Printed Circuit Board Signal Loss Testing Technology
1 Introduction
Printed circuit board (PCB) signal integrity is a hot topic in recent years. There are many research reports in China that analyze the influencing factors of PCB signal integrity, but the current status of signal loss testing technology is relatively rare.
The signal loss of the PCB transmission line is the conductor loss and dielectric loss of the material, and is also affected by factors such as copper foil resistance, copper foil roughness, radiation loss, impedance mismatch, and crosstalk. In the supply chain, the acceptance criteria of CCL manufacturers and PCB Express manufacturers use dielectric constant and dielectric loss; while the index between PCB express factory and terminal usually uses impedance and insertion loss, as shown in Figure 1.
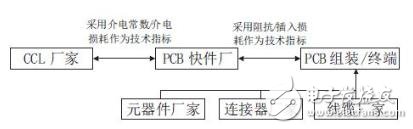
Figure 1 PCB material and some technical indicators of assembly
For the design and use of high-speed PCB, how to measure the signal loss of PCB transmission line quickly and effectively is of great significance for the setting of PCB design parameters and the simulation debugging and control of the production process.
2 The status of PCB insertion loss testing technology
The PCB signal loss test methods currently used in the industry are classified from the instruments used and can be classified into two categories: time domain based or frequency domain based. The time domain test instrument is a Time Domain Reflectometry (TIDR) or a Time Domain Transmission (TDT); the frequency domain test instrument is a Vector Network Analyzer (VNA). In the IPC-TM650 test specification, five test methods are recommended for PCB signal loss testing: frequency domain method, effective bandwidth method, root pulse energy method, short pulse propagation method, single-ended TDR differential insertion loss method.
2.1 frequency domain method
The Frequency Domain Method mainly uses a vector network analyzer to measure the S-parameters of the transmission line, directly reads the insertion loss value, and then uses the fitted slope of the average insertion loss over a specific frequency range (eg, 1 GHz to 5 GHz). Measure the pass/fail of the board.
The difference in measurement accuracy of the frequency domain method mainly comes from the calibration method. Depending on the calibration method, it can be subdivided into SLOT (Short-Line-Open-Thru), MulTI-Line TRL (Thru-Reflect-Line) and Ecal (Electronic calibraTIon) electronic calibration.
SLOT is generally considered to be a standard calibration method. There are 12 error parameters in the calibration model. The calibration accuracy of the SLOT method is determined by the calibration component. The high-precision calibration component is provided by the measuring equipment manufacturer, but the calibration component is expensive and generally Only for coaxial environments, calibration takes time and increases geometrically as the number of measurement ends increases.
The Multi-Line TRL method is mainly used for non-coaxial calibration measurements. The TRL calibration is designed and fabricated according to the material of the transmission line used by the user and the test frequency, as shown in Figure 2. Although the Multi-Line TRL is easier to design and manufacture than the SLOT, the Multi-Line TRL mode calibration time also grows geometrically as the number of measurement ends increases.
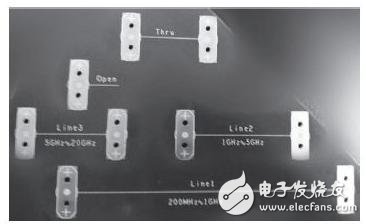
Figure 2 Multi-line TRL calibration
In order to solve the problem of calibration time-consuming, the measuring equipment manufacturer introduced the Ecal electronic calibration method. Ecal is a transmission standard. The calibration accuracy is mainly determined by the original calibration component. At the same time, the stability of the test cable, the repeatability of the test fixture device and the test are tested. Frequency interpolation algorithms also have an impact on test accuracy. Generally, the reference surface is calibrated to the end of the test cable with an electronic calibration component, and then the cable length of the clamp is compensated by means of de-embedding. As shown in Figure 3.
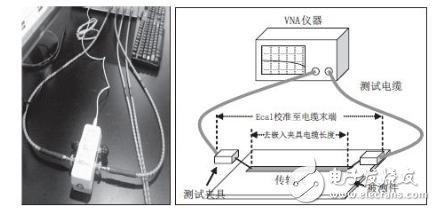
Figure 3 VNA Ecal mode calibration diagram and test diagram
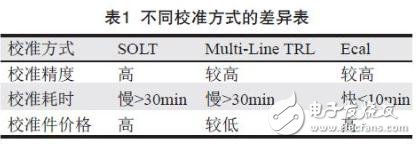
For example, to obtain the insertion loss of the differential transmission line, the comparison of the three calibration methods is shown in Table 1.
The PZDK series of smart chargers use high frequency switching rectification power modules. The charger is a smart charging device that was developed based on the technical requirements of the AGV (Automated Guided Vehicle) battery pack (group) charging. The working process of the charger is controlled by the microprocessor in real time, automatically turned on/off, and the operation is simple, safe and reliable. It uses a microprocessor as the main control unit and a color touch screen as a human-machine interface with flexible human-machine dialogue. The user can view the operating parameters and working status through the touch screen.


Lifepo4 Battery Charger,Scr Battery Charger,Lifepo4 Battery Packs Chargers,Thyristor Controlled Rectifier Charger
Xinxiang Taihang Jiaxin Electric Tech Co., Ltd , https://www.chargers.be